
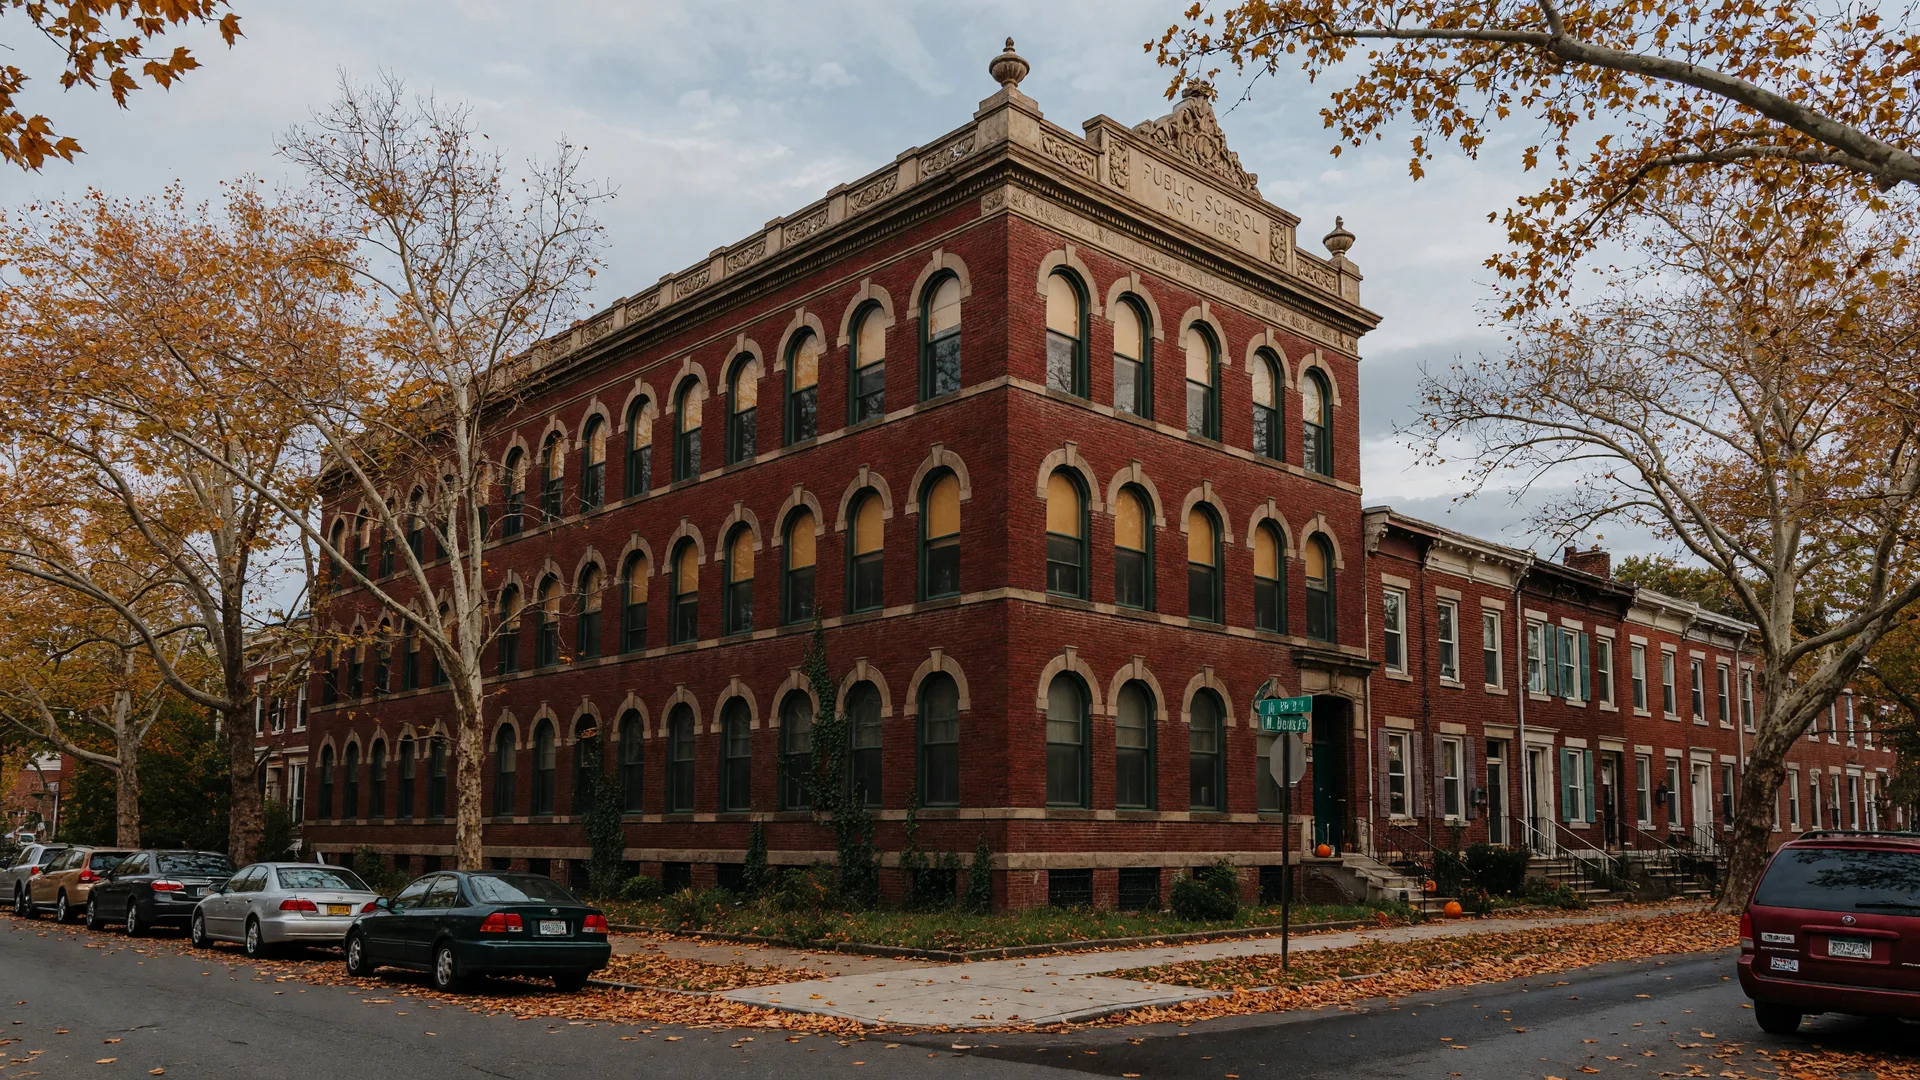
Not with one answer, because "Philadelphia schools" is 330 buildings, and Pennsylvania refuses to grade them. Citywide math proficiency ran about 25 percent in 2024-25 against a 42 percent state average, and the 1-10 ratings you see are mostly test-score math. The answer you need is per address, per building, from the state's own data.
I'm Craig Lerch, a broker with eXp Realty who works with relocating families, this is general information, not educational or legal advice. A conversation with the building's office belongs in your research; an education attorney, for anything that becomes a dispute. All figures were checked in October 2026; re-verify before you rely on them.
The question, as people actually ask it
Relocation threads on r/philly and r/SameGrassButGreener keep asking "are the schools really that bad?" when a family weighs the city against the suburbs. As phrased, the question has no single answer: it bundles the scale of the system, the test data, and the grading method. Pull them apart and you get a question you can answer for one home: what does the data say about the building this address feeds?
The numbers, from the state
Students in grades 3 through 8 take the PSSA; high schoolers take Keystone exams; the state publishes proficiency for every building. On the 2024-25 results, released November 14, 2025, School District of Philadelphia students scored proficient or above at 25.1 percent in math and 33.2 percent in English language arts, against statewide averages of 41.7 and 49.9 percent on the same tests (Pennsylvania Department of Education, verified October 2026). Philadelphia's math rate rose from about 22 percent the prior year; ELA held roughly level (PDE, verified October 2026).
Now the scale: as of October 1, 2025, Philadelphia's public school system enrolled 198,405 students across 330 schools, 218 district schools, 31 alternative education schools, and 81 charters (School District of Philadelphia Office of Research and Evaluation, verified October 2026). One mechanical rule matters for timing a move: a child must be 5 on or before September 1 to start kindergarten (SDP, verified October 2026).
What the 1-10 ratings actually measure
Most people meet the system through a rating site first. GreatSchools publishes its methodology: for elementary and middle schools, the 1-10 summary is built from two components, test scores and student progress, weighted evenly when both are available; high schools add a college-readiness component; and community reviews do not change the number (GreatSchools, verified October 2026). Weights shift when data is thin, and other sites run different recipes, so two sites can disagree about the same building. A rating is a summary of test-based indicators, not an inspection of the faculty, the building, or the program.
Pennsylvania's official report card has no letter grade
Pennsylvania does not grade schools A-F and has not published a single overall score for a building since replacing the old School Performance Profile in 2018. The Future Ready PA Index reports each school in three color-coded categories: academic performance (PSSA and Keystone proficiency), student growth, and college and career readiness. Each indicator shows the percentage meeting the outcome against the statewide average and goal, by student group (Pennsylvania Department of Education, verified October 2026).
The growth category is the part most outsiders never see. It runs on PVAAS, the Pennsylvania Value-Added Assessment System, which compares each group's year-over-year progress on the PSSA and Keystone exams against statistically expected progress given where those students started (PDE, verified October 2026). Proficiency asks how high students score; growth asks how much closer to the standard they move each year, and a building can sit below the state average on proficiency yet still meet the growth standard. That distinction is the most useful thing to read, and a national relocation listicle will not tell you about it.
How it differs across the metro
Within Pennsylvania, the unit changes between city and suburbs. In Philadelphia, your street address assigns you to a catchment school by default, with separate tracks: School Selection for criteria-based and open-seat schools, and charters through a lottery. The 2027-28 School Selection window opened October 5, 2026 and closes November 24, 2026 (SDP, verified September 2026). In the suburbs, the unit is the district: Pennsylvania has roughly 500, the line follows the street address rather than town or ZIP, and there is no statewide open enrollment (PA Department of Education, verified September 2026).
New Jersey runs roughly 580 to 600 districts and reports through its School Performance Reports, which carry a single summative score rather than a letter grade (NJDOE, verified October 2026). Delaware has about 19 districts and uses the Delaware School Success Framework, which labels schools Exceeds, Meets, Approaching, or Well Below Expectations (Delaware Department of Education, verified October 2026). The label differs by state; the task does not: check the official data for this exact building.
Coming from California: what surprises people
Californians arrive with a head start. California retired the Academic Performance Index, a single 200-to-1,000 score with 800 as the target, and replaced it in 2017 with the California School Dashboard, which reports each school on multiple indicators color-coded red, orange, yellow, green, and blue, deliberately without an overall grade (California Department of Education, EdSource, verified October 2026). Pennsylvania's Future Ready Index runs on the same philosophy: several panels, no single verdict.
What surprises is the system underneath. One: Pennsylvania has roughly 500 districts, so the school question starts with a street address lookup, not a town name. Two: in the city, the useful unit is one of 330 buildings, and the district's address lookup plus the per-building Future Ready pages are public. Three: the seasonality. School Selection and charter deadlines run in fall for the next year: October house-hunters are inside the 2027-28 window; January shoppers have missed it. That deadline is local knowledge, it moves timelines, and no national list will tell you about it.
What most people get wrong
- The rating is a school's report card. The 1-10 number for an elementary or middle school is roughly half test scores and half student growth, with college readiness added at the high school level; it does not include faculty, curriculum, arts, or climate, and reviews do not move it (GreatSchools, verified October 2026).
- "Philadelphia schools" are one thing. The district runs 330 buildings of very different sizes and programs; a citywide figure is an average across all of them (SDP, verified October 2026). Only building-level data answers a building-level question.
- The state grades schools A-F. Pennsylvania, New Jersey, and Delaware all avoid letter grades on official report cards (PDE, NJDOE, DDOE, verified October 2026); the letters you see come from private sites with their own formulas.
- Low proficiency means no growth. Proficiency and growth are separate panels in the state index; a building can be below the state average on proficiency and still meet the growth standard, so ask for both numbers before concluding anything (PDE/PVAAS, verified October 2026).
- The ZIP or the town tells you the district. In Pennsylvania the street address does: district lines do not follow ZIP codes, and there is no statewide open enrollment (PA Department of Education, verified September 2026). Verify against the district's own lookup.
- A low rating means the answer is settled. A rating is a snapshot of one year's tests; the growth panel measures change. Read all three panels for the building your address feeds, then visit it. A number alone decides nothing.
Your next step
Run the numbers for one address, in this order. One: give the exact street address to the district's lookup, not a ZIP or neighborhood name, and note the assigned building (schoolprofiles.philasd.org in the city; the district office in the suburbs). Two: open that building's Future Ready PA Index page and read proficiency, growth, and readiness against the statewide comparison. Three: if the address is in the city and the move targets the 2027-28 year, decide before November 24, 2026 whether School Selection or charter applications are part of the plan. Four: for a kindergarten start, confirm the September 1 cutoff against the move-in date. Five: visit the building and ask how the staff reads its own data, typical class size, and what happens after the first test.
The school calendar runs ahead of the moving calendar, so timing is what families miss. Ask for my relocation timeline worksheet and I will map the application windows, enrollment cutoffs, and offer timing onto your target move date.