
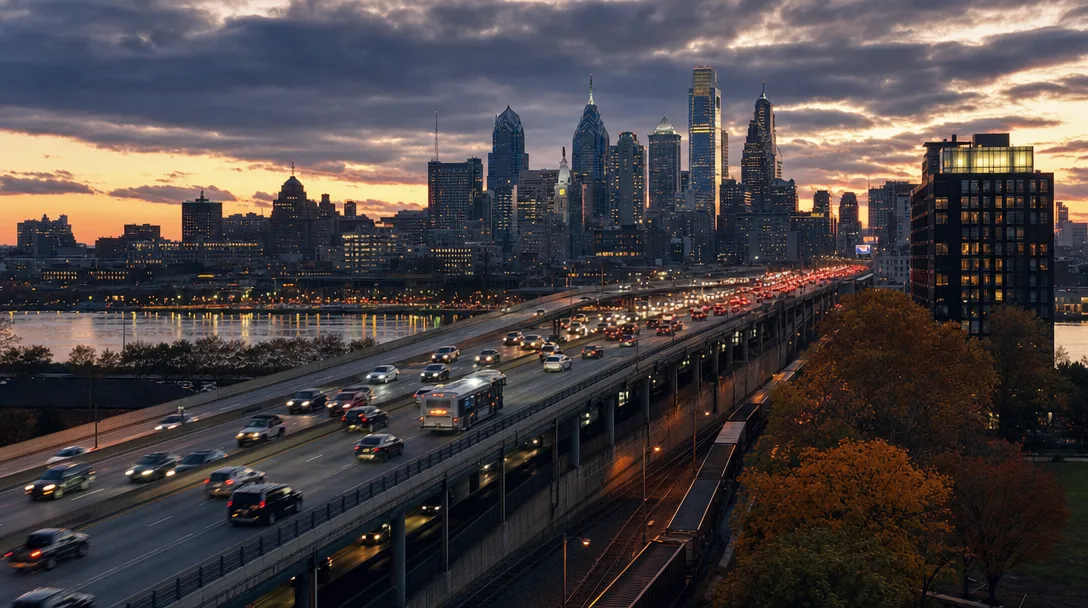
The two congestion measures rank Philadelphia and Los Angeles in opposite order. INRIX put Philadelphia third in the US for 2025, 101 hours lost per driver, ahead of Los Angeles at 87; TomTom put Los Angeles first among US cities. Average commutes are a tie: 29.7 minutes in the Philadelphia metro, 29.5 in Los Angeles (ACS 2024, verified November 2026).
I'm Craig Lerch, a broker at eXp Realty. LA-area buyers ask this on nearly every relocation call, because the phrase "Philly has no traffic" rarely survives an actual commute. Every figure below is verified against the published source this run: Census ACS 2024 commute data, the INRIX 2025 Global Traffic Scorecard, the TomTom Traffic Index 2025, current fare pages, and permit and garage rate lists, all date-stamped in place.
The headline: average commutes are tied
Census ACS 2024 figures put the mean one-way commute at about 29.5 minutes in the Los Angeles-Long Beach-Anaheim metro and 29.7 minutes in the Philadelphia-Camden-Wilmington metro, against 27.2 minutes nationally (Census Bureau via Census Reporter, verified November 2026). Two tenths of a minute is noise, so the honest headline is that the average worker in these two metros spends the same time getting to work. The averages hide the structure, which is why the congestion indexes tell a different story.
Drive-alone shares are close as well: 65.5% of LA metro workers drove alone in 2024, about 62.8% in the Philadelphia metro, and 69.2% nationally (ACS 2024, verified November 2026). Both metros sit below the national share.
The congestion indexes disagree, and each is measuring something real
INRIX's 2025 Global Traffic Scorecard (released December 2025) ranks Philadelphia the third most congested city in the US and fifth globally, at 101 hours lost per driver per year, up 31% from 77 hours in 2024 and worth roughly $1,860 per driver. Los Angeles ranks fourth in the US and tenth globally at 87 hours lost, about $1,602 per driver, down about 1% from 2024. The US average was 49 hours, up 6 hours from 2024 (INRIX, verified November 2026).
TomTom's Traffic Index for 2025 (released January 2026) reverses the order. It ranks Los Angeles the most congested US city and fifth globally, at a 59.8% congestion level, about 83 hours lost during rush hour. Philadelphia ranks 21st among US cities at a 37.5% congestion level, about 72 hours lost during rush hour. The two publishers measure different things: INRIX estimates delay across the whole urban road network over peak periods, while TomTom measures delay on a typical commute against free-flow speed. Neither ranking is wrong, and the two are not directly comparable to each other.
The structural difference: freeways versus a street grid
Los Angeles congestion spreads across a web of freeways, the 405, 5, 10, and 101 plus their connectors, and surface arterials, and it runs for much of the day. The Philadelphia metro's limited-access network is much smaller: I-95 along the Delaware River, I-76 (the Schuylkill Expressway), I-676 (the Vine Street Expressway across the center of the city), and I-476 at the metro's western edge. Inside the city, most movement happens on the colonial street grid, much of it on one-way pairs where the parking lane is also the travel lane.
That is why the two cities feel different behind the wheel even with tied averages. Philadelphia transplants in relocation threads describe the delay as arriving in two short windows a day rather than stretching across it (r/philadelphia California-transplant threads, 2015 through October 2025, retrieved this run), and the indexes support the mechanics: the delay sits on a handful of arterials in the morning and evening peaks, while off-peak movement on the grid stays freer. An LA driver experiences delay as a constant of the day. Both are real, just different shapes of congestion.
Transit: the fare flips, the reach differs
LA Metro's base fare is $1.75 on buses and trains, transfers are free for two hours when you tap a TAP card, and fares cap at $5 per day and $18 per week (metro.net, verified November 2026). SEPTA's base fare is $2.90 for bus, trolley, or subway travel, with two free transfers within two hours; the 21.5% fare increase took effect September 1 and 14, 2025 (septa.org, verified September 2026 and reconfirmed this run). The Philadelphia ride costs about 66% more than the Los Angeles ride before transfers.
The reach is the other half. SEPTA's 13 Regional Rail lines fan out from Center City into station towns in Montgomery, Bucks, Delaware, and Chester counties, and PATCO runs 24/7 between Center City and South Jersey at $2.25 to $3.00 (verified September 2026). LA Metro operates an extensive bus system plus a growing rail network. Neither system is inherently better; the rail commute option simply exists in very different places in the two metros, and the fare is only half of the calculation.
Parking is where the difference actually lands
LA residential parking permits run $34 per year per vehicle in a Preferential Parking District, capped at 3 per household, with visitor hangtags at $22.50 per four months, and $15 per year in Overnight Parking Districts; LA street meters rose to $1.50 per hour in October 2025 (LADOT, verified November 2026). Philadelphia's Residential Permit Parking is a flat $75 per year per vehicle since September 1, 2024, capped at 3 per household, with motorcycle and scooter permits at $50 (Philadelphia Parking Authority, verified September 2026).
Monthly garage parking lands in the same band: roughly $180 to $301 on average in Downtown Los Angeles with typical spots from $200 to $350, and Center City Philadelphia averaging about $275 a month, typical $200 to $350 (SpotHero and Spacer samples, verified November 2026). So the monthly parking bill in the two downtowns is comparable. The difference is the mechanism. Los Angeles development assumes off-street parking, while a Philadelphia rowhouse block may have none at all, which moves parking from an operating cost into a house-selection question.
Vehicle ownership tracks that split. About 7.9% of LA metro households have no vehicle (ACS 2020-2024, verified November 2026). The Philadelphia metro no-vehicle share was not retrievable from the sources I could verify this run; an older city-level analysis put the city of Philadelphia near one in three households, cited here with the flag that it is old data and not re-verified.
What most people get wrong
"Philadelphia has no traffic" is the common claim, and the 2025 indexes refute it. INRIX put Philadelphia third in the US at 101 hours lost per driver, above Los Angeles at 87. Visitors miss it because of the structure: the delay sits on I-76, I-95, and the I-676 approach lanes in specific windows rather than across the whole day, and the grid moves freely at off-peak hours.
The reverse claim, that Los Angeles is worse in every column, is also wrong. The commutes are statistically tied, Philadelphia metro workers drive alone below the national share, and the rail network reaches station towns and a 24/7 New Jersey line most LA drivers do not expect. Which city looks worse depends on the single column you pick: there is no overall winner, only per-measure results.
What genuinely surprises someone from LA
- The freeway network essentially stops at the city: no freeway crosses the center, the two main arteries I-76 and I-95 are the ones that jam, and route planning becomes a one-road decision.
- The commute average is a tie: the same 29 to 30 minutes, with a different shape, shorter windows, narrower streets, more intersections, and a parking lane used as a travel lane.
- Parking, not traffic, decides the car question. A $75 annual permit or a $250 monthly garage versus a driveway or garage at a suburban address moves the budget more than any congestion number.
- The clocks run short for new residents: Pennsylvania requires a driver's license within 60 days of establishing residency, and vehicle title and registration within 20 days (PennDOT, verified September 2026).
- The fare and the reach point opposite ways: the base SEPTA ride costs $2.90 against LA Metro's $1.75, yet regional rail and PATCO serve four PA counties plus 24/7 South Jersey.
How it differs across the metro
Inside the city of Philadelphia, driving means the grid, one-way pairs, permit zones in many neighborhoods, and transit plus regional rail as real alternatives. In the four suburban PA counties, the typical commute is drive to a Regional Rail station or drive to I-76, the Pennsylvania Turnpike, or I-476, with driveways and garages far more common. In South Jersey, PATCO offers 24/7 rail into Center City while most of the housing stock is car-oriented. In Northern Delaware, I-95 north is the main artery. The commute test below works everywhere: run it at the actual address.
Next step: test the actual commute before you bid
Four checks settle the question for one address. First, run the exact route at the time you would travel, on a Tuesday, not a Sunday. Second, verify the parking situation at the property: permit zone, driveway, garage, or pure street. Third, run the rail alternative from the nearest station and add the walk at both ends for a true door-to-door number. Fourth, write down the worst case, the snow day, the game night, the morning after a holiday, and make sure the timing and budget tolerate it. For a specific ticket or tow dispute, use the authority's current appeal process.
You cannot drive I-95 from California, but you can see it. Book a relocation call and I will send a video walkthrough of a shortlisted property: the street, the parking, and the block at commute time.